Spring 2026 Update Research and Trends
How Travelers Are Feeling Right Now
Despite economic uncertainty and global headlines, people are still prioritizing travel. Recent research shows that more than six in 10 travelers say travel is a top spending priority in the near term, and annual leisure travel budgets have reached a record high. Nearly eight in 10 travelers already have at least one trip planned for this summer. (Source: Future Partners, State of the American Traveler, March 2026)
The research also shows a shift in how people travel. More than half of travelers say they prefer staying in one place rather than rushing between multiple destinations. Younger travelers are leading this trend—67% of Gen Z travelers say they dedicate their trips to a single destination. And just over half of all travelers say they want to immerse themselves in local culture, nature and daily life when they visit a new destination.
This is good news for Western Montana. Our region is built for this kind of travel—slowing down, exploring small towns, and connecting with the landscape and the people who live here.
The Bigger Picture
Nationally, the travel industry entered 2026 on steady ground. Total travel spending is up slightly, and hotel demand ticked up for the first time in seven months. Domestic travel—people traveling within the U.S.—continues to drive the industry.
International travel is a different story. Visitors from outside the U.S. declined again at the start of the year, continuing a months-long trend. Canadian travel to the U.S. has been down 20–30% compared to last year, hitting border communities and destinations that have historically relied on Canadian visitors. For Glacier Country, this aligns with the border crossing data we shared last quarter. (Source: U.S. Travel Association)
The outlook for the rest of 2026 is cautiously optimistic. International visits are expected to grow later in the year, and domestic travel remains stable.
Our Response
We're making adjustments, but we're not backing away. We know how important the visitor economy is to Montana communities and businesses.
That means we're continuing to invest in Canadian markets even during the downturn—these are long-term relationships worth maintaining. We're focusing on markets showing strength: direct fly markets from MSO and FCA/GPIA airports, along with regional drive markets like Spokane, Seattle, Denver and Salt Lake City—places within a day's drive where travelers are already seeking destinations like ours. We're also reaching Montanans across the state who want to explore their own backyard.
We're using tools like MindTrip to help travelers discover the region in new ways. And we're continuing our work to spread visitation across all eight counties and throughout the year—directing travelers to communities that offer the experiences they seek and have the seasonal capacity to welcome them.
The landscape is shifting, but Western Montana’s Glacier Country is positioned to adapt.
Winter 2026 Update Research and Trends
2025 Visitor Trends for Glacier Country Region (January–November)
As we approach year-end, trend data from Zartico provides a snapshot of visitation patterns across Glacier Country through November 2025. While the year has seen modest softening compared to 2024, the data tells a nuanced story shaped by both seasonal factors and external pressures.
Year-to-Date Trends (January–November 2025)
For the first 11 months of 2025, Glacier Country saw a 5.5% decrease in visitation compared to the same period last year. Out-of-state visitation declined by 3%, accommodation stays by visitors decreased by 5.4% and overall visitor spending was down 1.8%. Sixty percent of all visitor spending came from in-region travelers. The top visitor markets were in-region and residents from greater Montana, followed by Spokane, WA (9%), Denver, CO (6%), Seattle-Tacoma, WA (6%), and Salt Lake City, UT (4%). (Source: Zartico)
Visitation to Glacier National Park remained relatively strong, although slightly behind that of 2024. Cumulative visitation through September was down about 1.4%, and through October was down about 2.5%. However, data from the federal government shutdown period is incomplete, as visitor tracking did not include manned entrance gates during that time. (Source: National Park Service)
Fourth Quarter Snapshot
Q4 of 2025 showed steeper declines, with visitation down 10%, out-of-state visitation down 6%, accommodation stays down 6% and visitor spend down 3%. In-region spending accounted for 63% of overall spending during the quarter. The top markets remained consistent, with Spokane, WA (10%), Seattle-Tacoma, WA (6%), Denver, CO (5%), and Salt Lake City, UT (3%) following, along with Montana residents (17%). (Source: Zartico)
Lodging trends for September through November presented a mixed picture: Hotel occupancy was down 6% compared to the same period last year, while short-term rental occupancy increased by 25%. With 75 communities across eight counties, pinpointing the drivers behind this shift is difficult, but the contrast is worth watching. (Source: KeyData and Amadeus)
National Context
What we're seeing in Glacier Country mirrors national trends. According to the U.S. Travel Association's Fall 2025 forecast, international inbound visits are projected to decrease 6.3% in 2025—the first decline since 2020. Fewer visits from Canada are the primary driver of this decrease. The U.S. Travel Insights Dashboard reported that Canadian inbound travel was down 20–30% in October, consistent with recent months, and that international inbound has been on a six-month downward trend. Hotel room demand nationally has also continued to slip. On a more positive note, domestic leisure travel is forecast to grow 1.9% in 2025, as Americans continue to prioritize travel despite concerns about inflation and economic conditions. (Source: U.S. Travel Association)
What's Behind the Numbers
The fourth quarter is historically one of our softer periods, but this year brought additional headwinds. The federal government shutdown affected operations across all federal entities, including Glacier National Park. While fall weather was favorable, Canadian travel remains significantly below that of prior years, and national trends show a decrease in overall international visitation. These factors, combined with ongoing economic pressures, contributed to the weaker fourth-quarter 2025 performance.
Fall 2025 Update Research and Trends
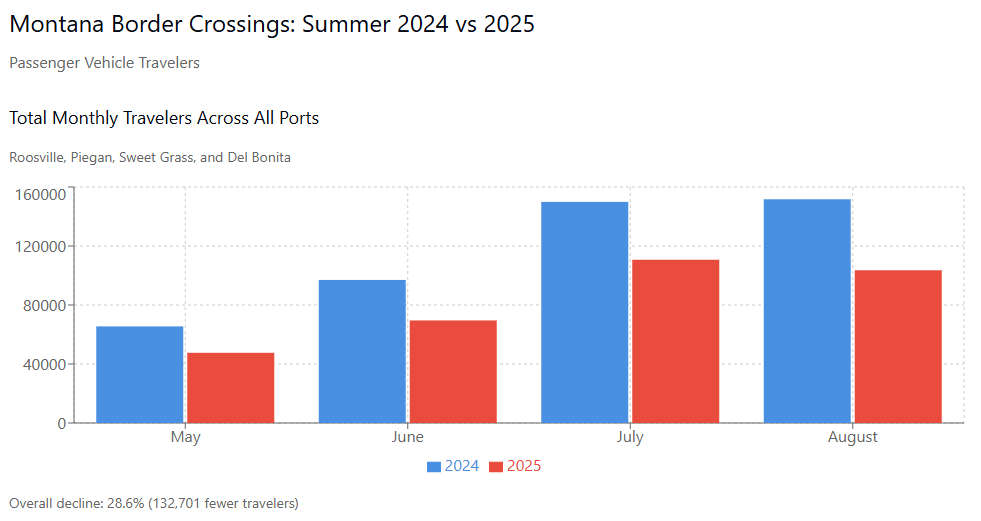
Montana Canadian Border Crossing Analysis: Summer 2024 vs. 2025
We monitored border crossing data from May through August this year. The numbers from summer 2025 confirm what many of you have likely been experiencing in your own businesses and communities. Understanding these trends will help us all make informed decisions as we plan for the months ahead.
What the Numbers Show
Our analysis of Montana's five major border crossings in or near our region shows significant declines in passenger vehicle travelers during summer 2025 compared to the same period in 2024. All crossings experienced double-digit decreases, with an overall decline of 28.6 percent representing 132,701 fewer travelers across the four months from May through August.
Montana's border crossings processed 331,353 passenger vehicle travelers this past summer, down from 464,054 in summer 2024. Piegan experienced the steepest decline at 40.1%, while Glacier County overall showed a 38.3% decrease.
Individual Port Performance
Roosville (Lincoln County)
Summer 2024: 141,889 travelers
Summer 2025: 112,333 travelers
Change: 20.8% decline
The monthly breakdown shows May with the steepest drop at 29.1%(22,520 to 15,956), improving somewhat in July to 16.0% (44,313 to 37,205), then declining again in August to 21.4% (45,753 to 35,961).
Piegan (Glacier County)
Summer 2024: 158,352 travelers
Summer 2025: 94,872 travelers
Change: 40.1% decline
This crossing showed consistent deterioration month over month, starting at 21.7% in May (14,775 to 11,567) and reaching 43.9% by August (55,665 to 31,243).
Sweet Grass (Toole County)
Summer 2024: 147,810 travelers
Summer 2025: 111,441 travelers
Change: 24.6% decline
Sweet Grass showed its best performance in July, with a 19.5% decline (45,205 to 36,375). The decline was higher in May, at 29.2%, and in August, at 28.7%.
Del Bonita (Glacier County)
Summer 2024: 16,003 travelers
Summer 2025: 12,707 travelers
Change: 20.6% decline
Del Bonita's pattern was the most consistent, with declines ranging from 17.0% to 25.1% across all four months.
Chief Mountain (Glacier County)
Summer 2025: 41,232 travelers
We don't have 2024 comparison data for Chief Mountain, but the 2025 numbers show the typical seasonal pattern we expect, with traffic building from 1,275 in May to a peak of 16,076 in July.
County-Level View
When we look at the data by county, the picture becomes clearer:
Lincoln County saw a 20.8% decline, losing 29,556 travelers compared to last summer.
Glacier County was hit hardest with a 38.3% decline, representing 66,776 fewer travelers.
Toole County experienced a 24.6% decline, with 36,369 fewer travelers.
What This Means
The loss of 132,701 travelers during our summer season represents a substantial reduction in cross-border traffic to the region.
Why We're Seeing These Changes
The consistent decline pattern across all ports of entry points to systemic factors at play. These include unstable international policies and ongoing U.S.-Canada trade tensions, featuring tariffs on Canadian goods implemented in March 2025 and escalated in August 2025. We're also seeing the effects of exchange rate fluctuations, increased fuel costs, and enhanced border security measures.
Our Response
Western Montana's Glacier Country will continue to include Canada in our paid media plans throughout 2025. We believe it's important to maintain our presence in the Canadian market even during challenging times.
This analysis is based on U.S. Customs and Border Protection data for passenger vehicles crossing the Montana-Canada border between May and August 2024 and 2025.
Winter 2025 Update Research and Trends
2024 Visitor Trends for Glacier Country Region (January – December)
As of January 3, 2025
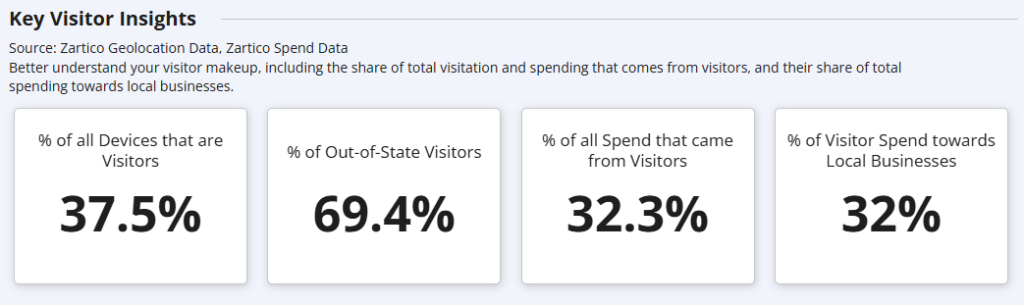
This detailed visitor trend report explores the behaviors, origins and economic contributions of visitors to the Glacier Country region throughout 2024. In this data, a visitor is defined as someone traveling to the Glacier Country region from other areas of Montana and the U.S. These insights help stakeholders understand tourism dynamics and plan strategically for future growth.
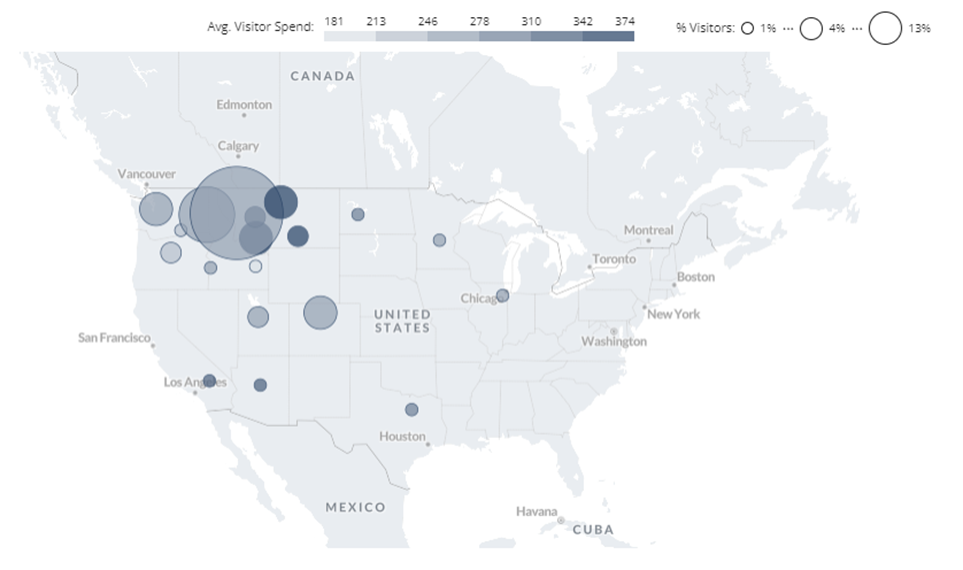
Where are visitors to the Glacier Country region from?
This image provides a breakdown of visitor origins (size of the bubble) and the average visitor spend (color shade of the bubble), showing how many travelers come from within Montana and from other states. The data underscores the regional and national appeal of Glacier Country as a destination.
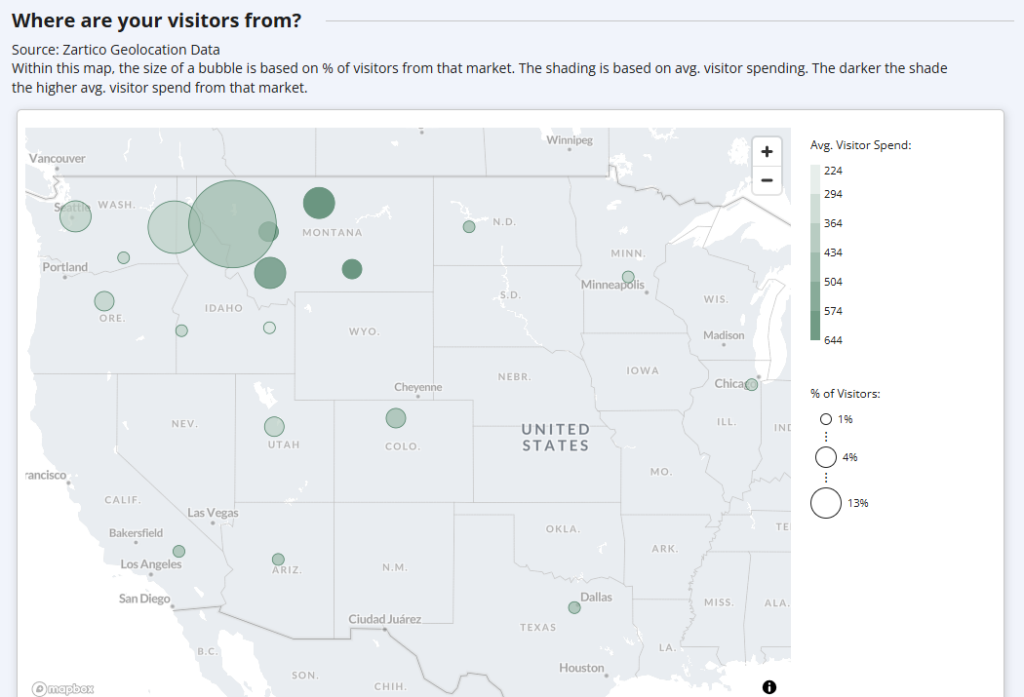
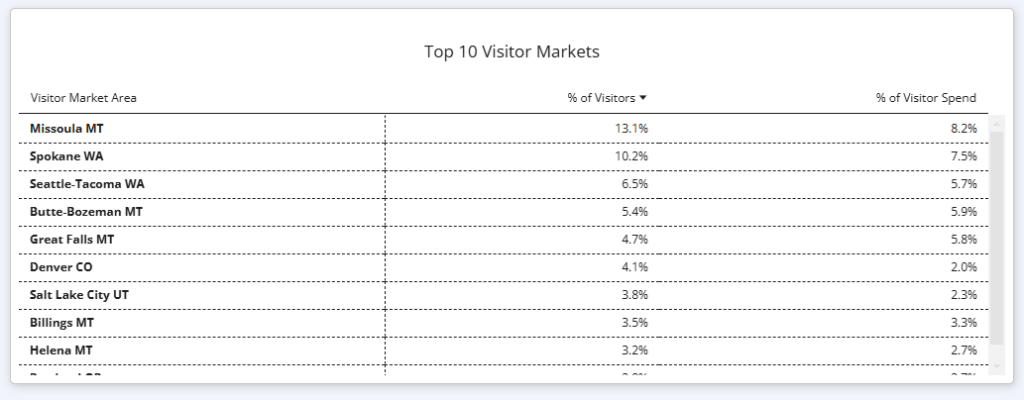
Here's a breakdown of visitor origins by DMA® (Designated Market Area). DMA regions are the geographic areas in the U.S. in which local television viewing is measured by Nielsen. The Missoula, Montana, DMA includes the counties of Flathead, Lake, Lincoln, Sanders, Mineral, Missoula, and Ravalli – not Glacier. The other locations represent the larger DMA region around that location as defined by Nielsen.
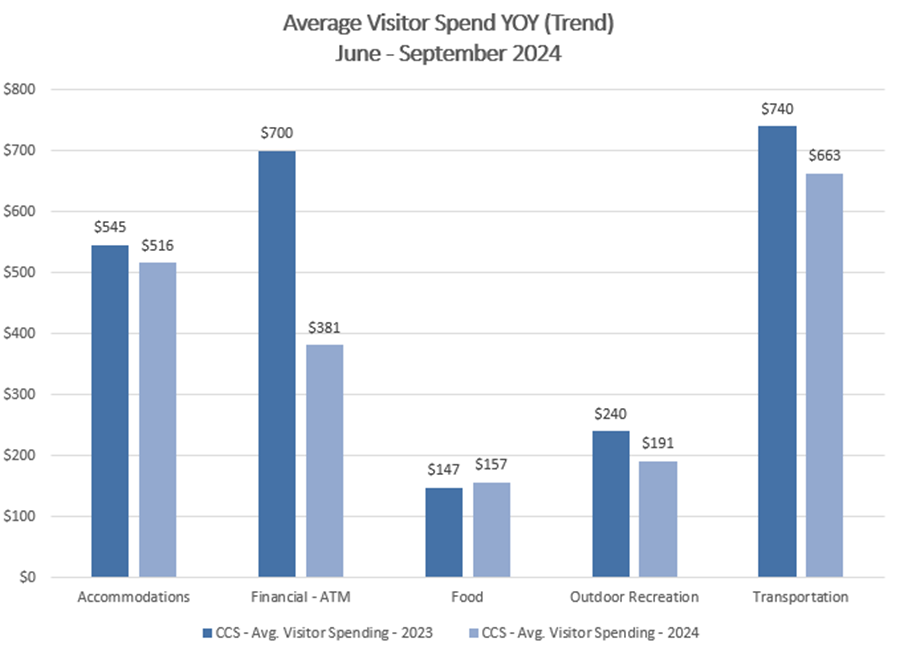
Economic Contributions of Visitors
This chart provides a comprehensive look at how much visitors are contributing to the local economy, detailing the financial benefits of tourism to the Glacier Country region.
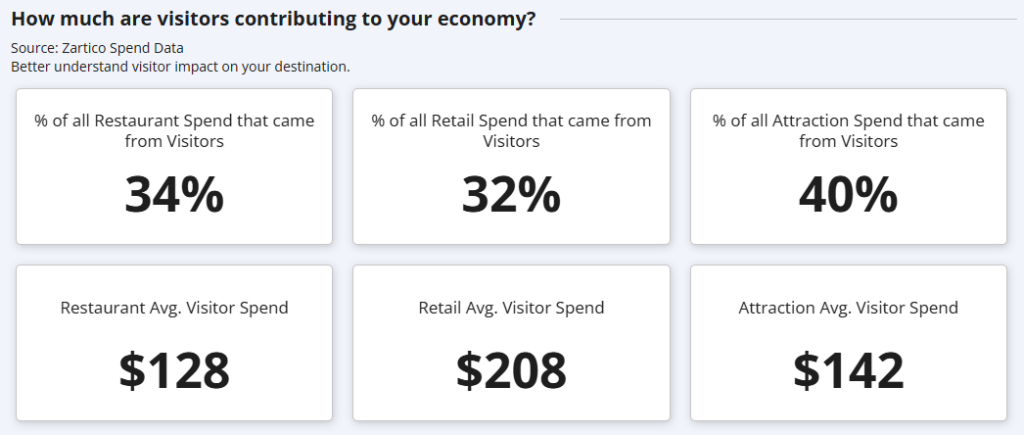
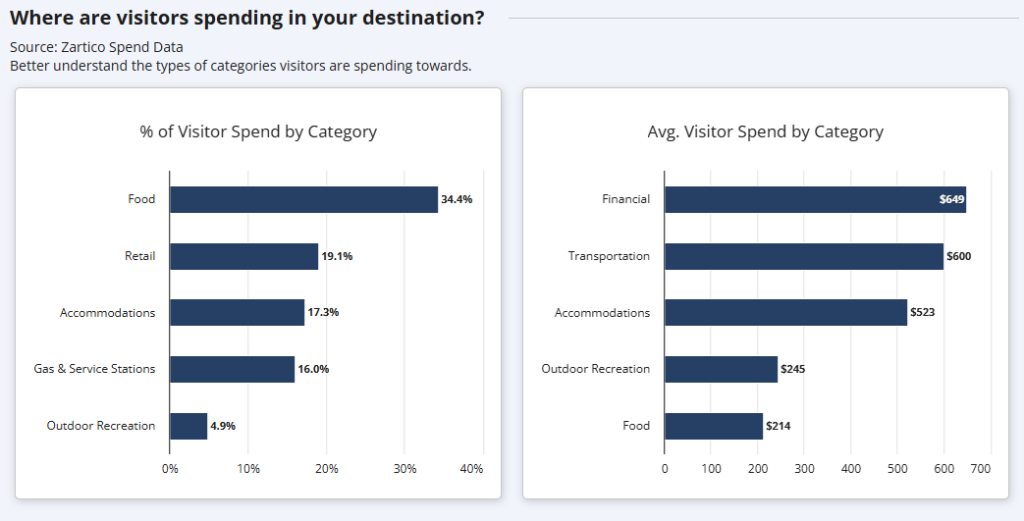
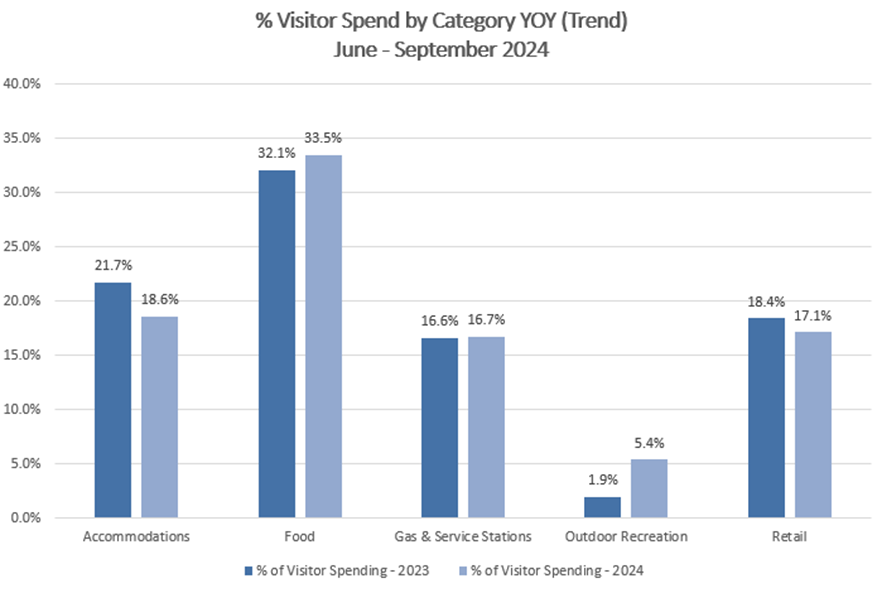
Categories of Visitor Spending
This is a breakdown of where visitors are allocating their spending, from accommodations and dining to retail and recreational activities. This helps identify the areas benefiting most from tourism dollars. Note: “Financial” includes ATM transactions.
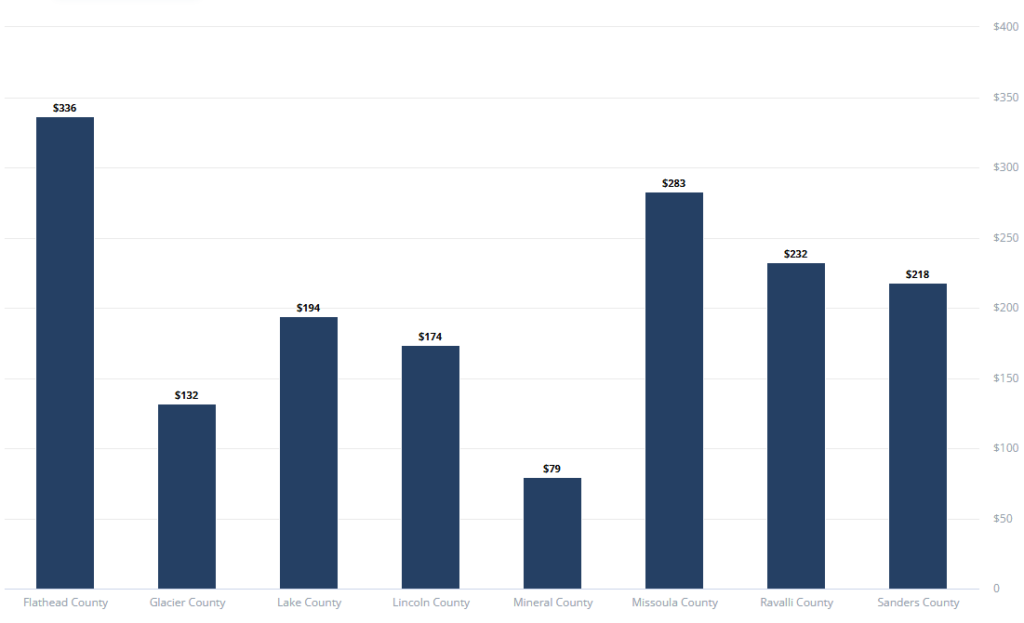
Average Visitor Spending by County
This data highlights the average expenditures by visitors in each county, emphasizing areas where tourism has a significant economic impact.
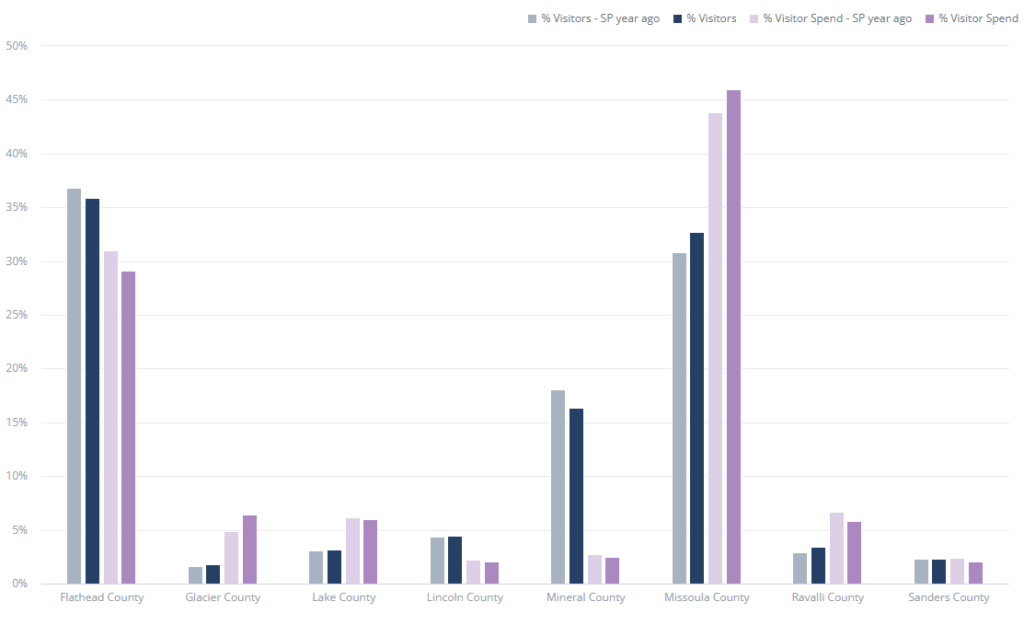
Visitor Distribution by County
This map showcases the geographic dispersion of visitors across the counties in Glacier Country, offering insights into the most frequented areas and their visitor spend—identifying regions with potential for growth.
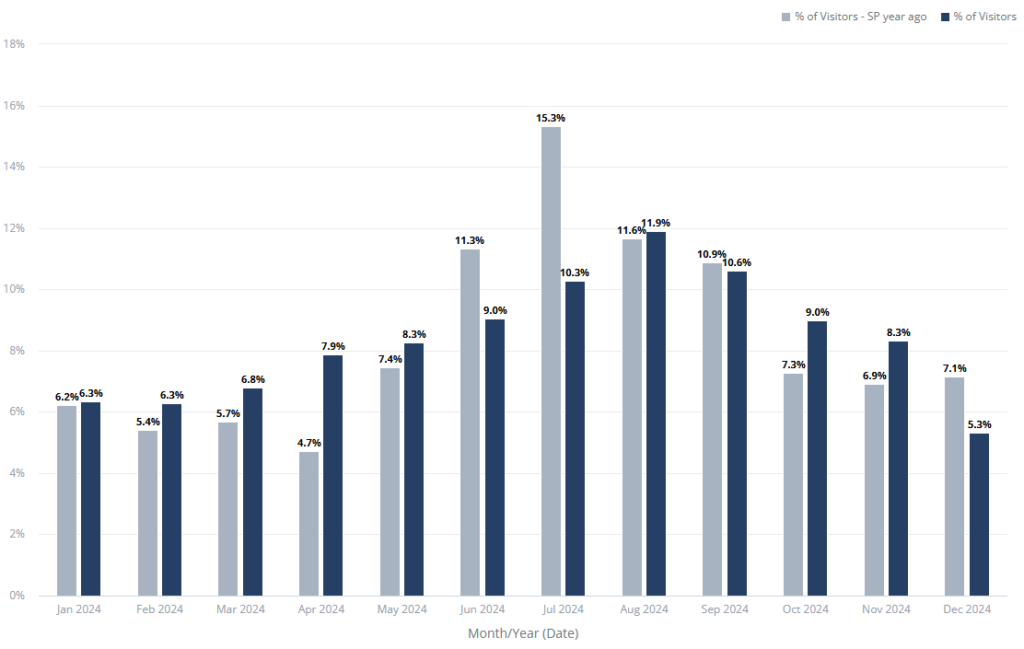
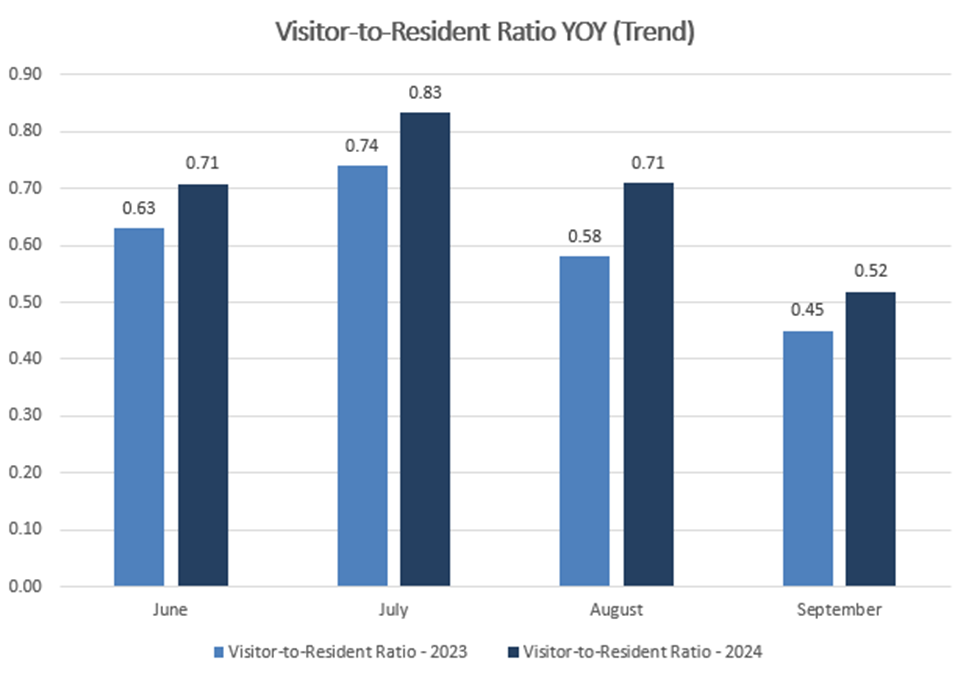
Resident Versus Visitor Percentages by Month
A comparison of the percentage of visitors to residents each month, illustrating how tourism interacts with local populations and highlighting the times when visitors have a larger physical presence.
Fall 2024 Update Research and Trends
Summer 2024 Visitor Insights: Who Explored Glacier Country? (June – September)
Now that we've shifted from fall to winter, it’s time to reflect on the travelers who experienced Glacier Country during the summer season. From June through August, Glacier Country welcomed visitors from near and far, eager to explore the breathtaking landscapes of our region, which spans Flathead, Glacier, Lake, Lincoln, Mineral, Missoula, Ravalli and Sanders counties. Here’s a closer look at where our summer visitors came from and the trends that shaped their travel to Western Montana this year.
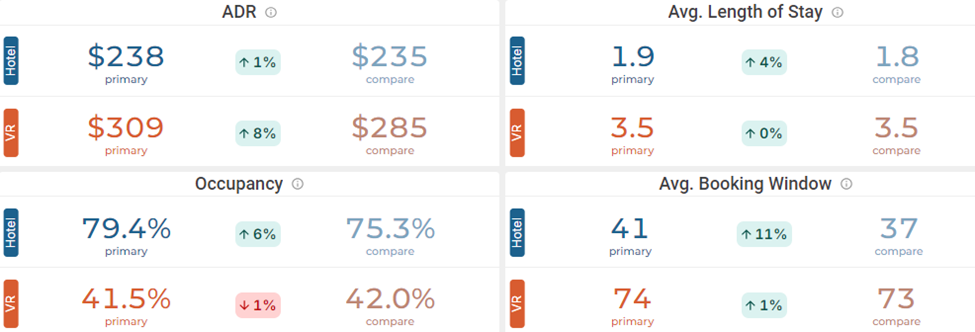
Trend data for June through September this year indicate the visitor-to-resident ratio was a little higher than 2023. The majority of visitors were from a 600-mile radius, with 28.8% being residents enjoying our own backyard, 15.8% from Washington, 4.3% from Colorado, 3.7% from Utah and 2.7% from Oregon. The group with the highest average visitor spend was our fellow Montana residents from outside the Glacier Country region ($342/day). The overall average national visitor spending was $195.25/person per day for the months of June – September, down from $204.75 in 2023. Overall lodging occupancy (hotel and short-term rental) was about flat, along with the average daily rate (ADR). The booking window for reservations increased by 10%, and the average length of stay held steady at 2 days for hotels and 3.5 days for short-term rentals. This trend data is not absolute but provides a glimpse into what is happening on the ground. We always measure what this data says against what data from the Institute for Tourism and Recreation Research says in their year-over-year reporting, which will be available in 2025.
Overall, the story we have at this time is that visitation in Western Montana has leveled out compared to the huge fluctuations since 2020. Glacier Country is a large region, and this data is for the region at-large. We are very interested in what you saw in your community and encourage you to reach out and share your thoughts. Email Racene Friede at racene@glaciermt.com.
| Visitor DMA* Market Area | % Visitors | % Visitor Spend | Avg. Visitor Spend |
| Missoula MT (Glacier Country Region) | 13.1% | 6.3% | $222 |
| Spokane WA | 9.2% | 6.8% | $222 |
| Seattle-Tacoma WA | 6.6% | 5.2% | $219 |
| Butte-Bozeman MT | 4.9% | 4.9% | $319 |
| Great Falls MT | 4.4% | 4.9% | $373 |
| Denver CO | 4.3% | 2.1% | $235 |
| Salt Lake City UT | 3.7% | 2.5% | $215 |
| Billings MT | 3.4% | 3.0% | $374 |
| Helena MT | 3.0% | 2.2% | $302 |
| Portland OR | 2.7% | 2.9% | $211 |
Top Origin Markets - In-State and Out-of-State
Year-Over-Year Trend Data (same period) June – September

Lodging Occupancy (Year-Over-Year Trend Data – same period) Hotel vs. Short-Term Rental (VR)
Summer 2024 Update Research and Trends
National Travel Indicators: The U.S. Travel Insights Dashboard, June 28, 2024
If you think travel trends fluctuate month to month or even week to week, you are probably right. The conversations we are having with businesses in Western Montana and statewide are inconsistent and vary community by community. To understand what is happening in-state, we need to understand the national trends.
According to the U.S. Travel Association Travel Insights Dashboard for the month of May 2024. All indicators show a consistent rate of growth year to date vs. the previous year, including overseas travel.
- U.S. travelers are choosing to travel internationally, with a 17.5% increase in May 2024 vs. May 2023 and a 19.6% increase in YTD vs. the previous year.
- Short-term rental demand increased by 8.9% to 11.7%, compared to hotel demand, which increased by 0% to 2%.
- National park visitation has slowed down with an average of 2% increase nationally.
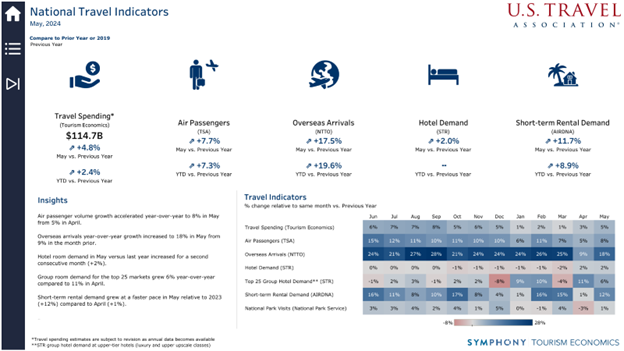
- Lodging demand was either flat or down from the previous year until April and May this spring, finally seeing a slight increase of 1.9%.

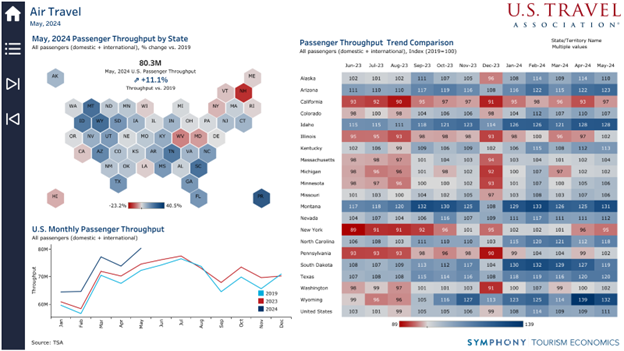
- Air passenger numbers remain strong, with a nationwide growth of 7.7% compared to 2023 and 11% compared to 2019.
- Montana’s passenger throughput has increased 31.4% since 2019.
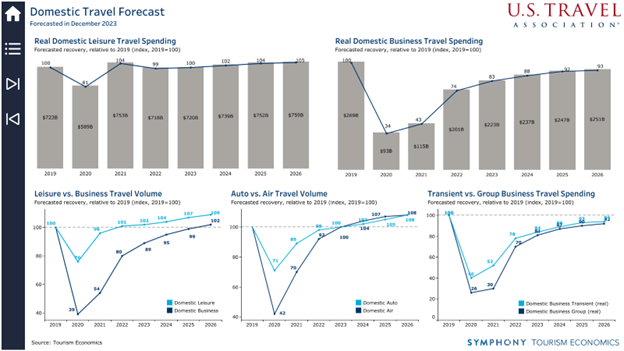
The domestic travel forecast remains strong, with domestic leisure spending keeping pace and domestic business travel spending continuing to recover—but a full recovery is still not forecast for at least a few more years.
Western Montana’s Glacier Country continues to monitor travel trends and share those insights.